Motorradstudie & Unfallstatistik:
Motorrad-/Fahrrad-Unfallstatistik
Download der Ergebnisse der Studie "Evaluation von freiwilligen Motorrad-Fahrtrainings" ist möglich! In dieser Studie sind - ergänzend zu den Daten der Statistik Austria - umfassende Unfallanalysen auf Basis der Unfallbeschreibungen von ca. 5.000 MotorradfahrerInnen enthalten.
2023
https://www.statistik.at/services/tools/services/publikationen/detail/1915
2022
https://www.statistik.at/services/tools/services/publikationen/detail/1607
2021
https://www.statistik.at/services/tools/services/publikationen/detail/1320
2020
https://www.statistik.at/services/tools/services/publikationen/detail/956
2019
https://www.statistik.at/services/tools/services/publikationen/detail/1026
Unfallstatistik: Motorradunfälle -
Todesopfer
|
Ö ges |
B |
K |
NÖ |
OÖ |
S |
St |
T |
V |
W |
|
|
1992 |
80 |
3 |
10 |
13 |
12 |
12 |
11 |
11 |
6 |
2 |
|
1993 |
96 |
4 |
8 |
24 |
25 |
7 |
11 |
4 |
4 |
9 |
|
1994 |
94 |
6 |
4 |
24 |
19 |
11 |
14 |
13 |
1 |
2 |
|
1995 |
85 |
4 |
2 |
27 |
15 |
7 |
13 |
10 |
3 |
4 |
|
1996 |
84 |
2 |
14 |
28 |
5 |
5 |
15 |
10 |
4 |
1 |
|
1997 |
111 |
3 |
7 |
30 |
12 |
13 |
19 |
14 |
8 |
5 |
|
1998 |
87 |
3 |
4 |
20 |
24 |
6 |
20 |
5 |
2 |
3 |
|
1999 |
103 |
3 |
4 |
23 |
21 |
10 |
20 |
13 |
3 |
6 |
|
2000 |
112 |
2 |
9 |
32 |
16 |
11 |
23 |
9 |
7 |
3 |
|
2001 |
108 |
8 |
12 |
18 |
20 |
5 |
21 |
20 |
3 |
1 |
|
2002 |
89 |
3 |
9 |
16 |
12 |
7 |
16 |
20 |
1 |
5 |
|
2003 |
109 |
3 |
7 |
25 |
24 |
5 |
18 |
16 |
5 |
6 |
|
2004 |
98 |
4 |
8 |
24 |
19 |
9 |
13 |
12 |
5 |
4 |
|
2005 |
98 |
2 |
4 |
25 |
24 |
6 |
24 |
5 |
4 |
4 |
|
2006 |
96 |
1 |
9 |
22 |
19 |
6 |
16 |
15 |
4 |
4 |
|
2007 |
96 |
4 |
10 |
19 |
21 |
4 |
17 |
14 |
0 |
7 |
|
2008 |
92 |
2 |
13 |
18 |
14 |
7 |
15 |
13 |
5 |
3 |
|
2009 |
87 |
2 |
3 |
20 |
12 |
14 |
17 |
10 |
4 |
5 |
|
2010 |
68 |
2 |
8 |
19 |
13 |
4 |
10 |
7 |
1 |
4 |
|
2011 |
68 |
3 |
3 |
20 |
4 |
6 |
17 |
10 |
2 |
3 |
|
2012 |
68 |
1 |
5 |
20 |
12 |
4 |
14 |
9 |
1 |
2 |
|
2013 |
87 |
3 |
12 |
18 |
17 |
14 |
7 |
13 |
1 |
2 |
|
2014 |
76 |
2 |
8 |
19 |
17 |
4 |
14 |
6 |
2 |
4 |
|
2015 |
83 |
2 |
11 |
22 |
17 |
7 |
11 |
11 |
1 |
1 |
2016 |
85 |
3 |
10 |
24 |
12 |
5 |
12 |
14 |
2 |
3 |
2017 |
83 |
7 |
6 |
13 |
12 |
13 |
15 |
10 |
3 |
4 |
2018 |
102 |
3 |
9 |
18 |
24 |
8 |
16 |
15 |
5 |
4 |
|
2019 |
78 |
4 |
4 |
17 |
18 |
4 |
16 |
11 |
1 |
3 |
Kleinmotorrad und Leichtmotorrad und Motorrad (ohne Mopeds)
(Quelle: Statistik Austria, für 2018: BMI, vorläufuge Zahlen)
Nach 2019: siehe oben!
Unfallstatistik: Motorradunfälle - Verletzte
|
2015 |
Ö ges |
4139 |
K |
NÖ |
OÖ |
S |
St |
T |
V |
W |
|
1992 |
3.209 |
74 |
209 |
558 |
611 |
228 |
443 |
374 |
166 |
546 |
|
1993 |
2.818 |
57 |
181 |
525 |
554 |
183 |
419 |
279 |
143 |
477 |
|
1994 |
3.169 |
57 |
218 |
580 |
582 |
199 |
491 |
357 |
173 |
512 |
|
1995 |
2.758 |
63 |
143 |
493 |
538 |
162 |
454 |
312 |
151 |
442 |
|
1996 |
2.703 |
49 |
193 |
556 |
477 |
192 |
352 |
313 |
141 |
430 |
|
1997 |
2.914 |
58 |
195 |
516 |
564 |
189 |
455 |
358 |
161 |
418 |
|
1998 |
3.119 |
70 |
216 |
558 |
536 |
189 |
461 |
444 |
163 |
482 |
|
1999 |
3.435 |
70 |
256 |
633 |
631 |
235 |
502 |
453 |
142 |
513 |
|
2000 |
3.653 |
100 |
282 |
673 |
626 |
222 |
495 |
515 |
139 |
601 |
|
2001 |
3.591 |
75 |
254 |
649 |
604 |
250 |
431 |
560 |
171 |
597 |
|
2002 |
3.348 |
74 |
268 |
588 |
571 |
214 |
429 |
462 |
186 |
556 |
|
2003 |
3.785 |
84 |
305 |
641 |
645 |
237 |
525 |
549 |
183 |
616 |
|
2004 |
3.485 |
65 |
327 |
561 |
557 |
243 |
480 |
502 |
171 |
579 |
|
2005 |
3.410 |
68 |
244 |
560 |
566 |
240 |
445 |
528 |
159 |
600 |
|
2006 |
3.658 |
89 |
281 |
602 |
589 |
273 |
484 |
556 |
163 |
621 |
|
2007 |
3.649 |
72 |
275 |
646 |
618 |
279 |
479 |
517 |
171 |
592 |
|
2008 |
3.394 |
65 |
287 |
567 |
492 |
252 |
531 |
504 |
137 |
559 |
|
2009 |
3.521 |
66 |
351 |
544 |
555 |
273 |
536 |
492 |
155 |
549 |
|
2010 |
3.221 |
66 |
342 |
507 |
478 |
254 |
484 |
445 |
130 |
515 |
|
2011 |
3.633 |
106 |
348 |
605 |
481 |
280 |
532 |
529 |
205 |
547 |
|
2011 |
3.633 |
106 |
348 |
605 |
481 |
280 |
532 |
529 |
205 |
547 |
|
2012 |
3.853 |
87 |
315 |
722 |
568 |
297 |
518 |
490 |
186 |
670 |
|
2013 |
4.071 |
83 |
344 |
681 |
604 |
319 |
619 |
533 |
189 |
679 |
|
2014 |
4.031 |
74 |
323 |
726 |
594 |
267 |
577 |
554 |
186 |
730 |
|
2015 |
4.139 |
77 |
393 |
753 |
575 |
298 |
582 |
535 |
197 |
729 |
|
2016 |
4.127 |
81 |
337 |
752 |
597 |
282 |
579 |
554 |
203 |
742 |
|
2017 |
4.120 |
88 |
366 |
767 |
559 |
303 |
612 |
538 |
194 |
693 |
|
2018 |
4.233 |
82 |
373 |
787 |
634 |
304 |
594 |
530 |
222 |
707 |
Kleinmotorrad und Leichtmotorrad und Motorrad (ohne Mopeds)
(Quelle: Statistik Austria)
Nach 2018: siehe oben!
Fahrradunfälle (inkl. E-Räder u. E-Scooter) - Todesopfer
|
Ö ges |
B |
K |
NÖ |
OÖ |
S |
St |
T |
V |
W |
|
|
2000 |
62 |
6 |
2 |
11 |
13 |
5 |
10 |
7 |
5 |
3 |
|
2001 |
55 |
4 |
2 |
13 |
11 |
4 |
6 |
8 |
3 |
4 |
|
2002 |
80 |
2 |
9 |
14 |
18 |
6 |
15 |
10 |
1 |
5 |
|
2003 |
56 |
2 |
5 |
19 |
17 |
3 |
8 |
1 |
1 |
0 |
|
2004 |
58 |
0 |
2 |
22 |
11 |
7 |
6 |
3 |
7 |
0 |
|
2005 |
47 |
3 |
4 |
8 |
10 |
6 |
6 |
5 |
3 |
2 |
|
2006 |
48 |
1 |
3 |
10 |
8 |
6 |
6 |
8 |
3 |
3 |
|
2007 |
37 |
3 |
1 |
9 |
9 |
4 |
4 |
3 |
2 |
2 |
|
2008 |
62 |
1 |
1 |
17 |
12 |
7 |
11 |
5 |
5 |
3 |
|
2009 |
39 |
0 |
0 |
13 |
8 |
2 |
10 |
2 |
3 |
1 |
|
2010 |
32 |
2 |
2 |
7 |
5 |
5 |
6 |
2 |
2 |
1 |
|
2011 |
42 |
1 |
1 |
8 |
12 |
7 |
5 |
4 |
3 |
1 |
|
2012 |
52 |
2 |
4 |
10 |
10 |
9 |
9 |
3 |
5 |
2 |
|
2013 |
51 |
0 |
3 |
12 |
2 |
4 |
6 |
6 |
4 |
1 |
|
2014 |
45 |
2 |
1 |
8 |
7 |
3 |
10 |
3 |
8 |
3 |
|
2015 |
39 |
1 |
5 |
7 |
5 |
5 |
6 |
5 |
2 |
3 |
|
2016 |
48 |
2 |
3 |
10 |
11 |
4 |
8 |
5 |
3 |
2 |
|
2017 |
32 |
1 |
0 |
6 |
8 |
4 |
6 |
5 |
1 |
1 |
|
2018 |
41 |
1 |
1 |
11 |
10 |
1 |
5 |
4 |
5 |
3 |
|
2019 |
32 |
3 |
0 |
8 |
9 |
5 |
3 |
2 |
2 |
0 |
Quelle: Statistik Austria
www.statistik.at
Nach 2019: siehe oben!
Fahrradunfälle - Verletzte
|
Ö ges |
B |
K |
NÖ |
OÖ |
S |
St |
T |
V |
W |
|
|
2000 |
5.912 |
106 |
565 |
767 |
1282 |
489 |
969 |
776 |
406 |
552 |
|
2001 |
5.509 |
96 |
526 |
712 |
1199 |
520 |
938 |
699 |
370 |
449 |
|
2002 |
5.837 |
121 |
545 |
757 |
1212 |
487 |
937 |
734 |
442 |
602 |
|
2003 |
5.804 |
117 |
576 |
669 |
1176 |
534 |
928 |
753 |
413 |
638 |
|
2004 |
5.422 |
95 |
421 |
680 |
1107 |
534 |
874 |
723 |
415 |
573 |
|
2005 |
5.412 |
96 |
446 |
676 |
1113 |
490 |
901 |
655 |
384 |
651 |
|
2006 |
5.335 |
112 |
467 |
623 |
956 |
547 |
910 |
652 |
428 |
640 |
|
2007 |
5.775 |
88 |
523 |
759 |
1041 |
651 |
930 |
714 |
443 |
626 |
|
2008 |
5.559 |
92 |
483 |
700 |
1045 |
598 |
900 |
711 |
443 |
587 |
|
2009 |
5.417 |
104 |
444 |
695 |
961 |
566 |
879 |
724 |
492 |
552 |
|
2010 |
4.835 |
98 |
395 |
665 |
858 |
517 |
766 |
600 |
411 |
525 |
|
2011 |
5.745 |
121 |
475 |
802 |
949 |
623 |
872 |
793 |
472 |
638 |
|
2012 |
5.417 |
104 |
444 |
695 |
961 |
566 |
879 |
724 |
492 |
552 |
|
2013 |
6.335 |
93 |
474 |
1.063 |
972 |
634 |
973 |
739 |
514 |
873 |
|
2014 |
6.654 |
120 |
475 |
1.095 |
1.059 |
660 |
945 |
819 |
559 |
913 |
|
2015 |
6.847 |
109 |
496 |
1.065 |
1.119 |
643 |
1.026 |
881 |
567 |
941 |
|
2016 |
7.331 |
133 |
466 |
1.142 |
1.100 |
825 |
1.096 |
968 |
636 |
965 |
|
2017 |
7.493 |
118 |
486 |
1.153 |
1.040 |
838 |
1.106 |
1.178 |
586 |
990 |
|
2018 |
8.173 |
128 |
514 |
1.232 |
1.214 |
916 |
1.162 |
1.313 |
691 |
1.003 |
Quelle: Statistik Austria
Nach 2018: siehe oben!
Tabellen: © mipra, Michael Praschl, Stättermayergasse 32/16 1150 Wien, Tel.: +43 1 494 80 60
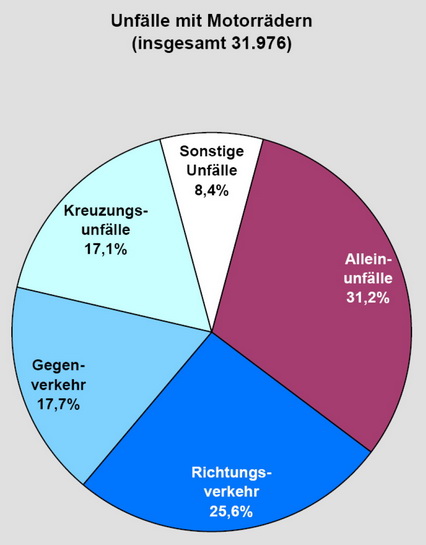
Unfalltypen - alle Motorradunfälle 1996-2005
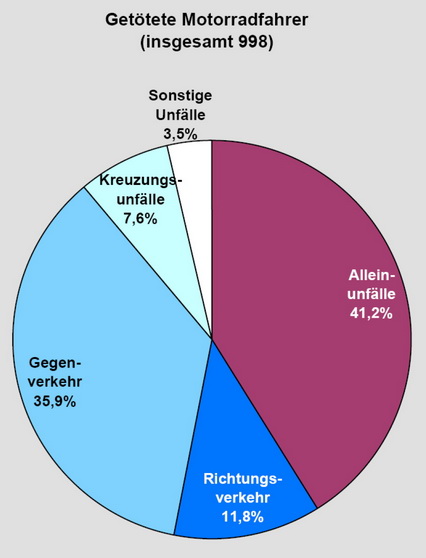
Unfalltypen - tödliche Motorradunfälle 1996-2005
Quelle: Statistik Austria